How to report SLA performance in Jira Service Management and export it
Open Reports in your service space and start with the SLA met vs breached, SLA success rate and Time to resolution reports. For a file with one row per request, the pages we read describe an automation rule and a queue export, or an app.
What Jira Service Management does on its own
Everything here is from Atlassian's pages, which we read on 13 November 2026.
- Reports. Atlassian's custom reports page lists Time to resolution, SLA met vs breached and SLA success rate, next to Created vs resolved. You open them from Reports in the space sidebar.
- SLA setup. A project admin creates an SLA under Space settings, Request management, SLAs. The SLA page allows up to 90 goals per SLA and says completed cycles stay as they are when you edit an SLA. Calendars hold a time zone, working days, time slots and holidays. Conditions say when counting starts, pauses and finishes.
- Time to resolution report. Atlassian's knowledge base article says each dot is the average time to resolution of the work items resolved on that day. A second article says the report follows your SLA calendar and pauses. The Resolution Time gadget subtracts Created from Resolution and counts all hours.
- Dashboard gadgets. The gadgets page lists a Service Space Report gadget, a Time to First Response Chart and a Resolution Time gadget.
- JQL. The SLA JQL page lists breached(), everBreached(), paused(), completed(), running(), withinCalendarHours(), elapsed() and remaining(). Its example
"Time to resolution" < remaining("2h")finds items due to breach within two hours, breached ones included.
The manual route, step by step
- Check the SLA names, goals, calendar and conditions for first response and resolution. Reports follow them.
- Open Reports. Read SLA met vs breached for counts and Time to resolution for the average. For a split by priority, Atlassian's custom report page lets a space admin add up to 20 series and filter each by work type, status, priority or component, or by JQL. That page applies to company-managed spaces only.
- List breaches with JQL, for example
"Time to first response" = everBreached(). The page says breached() checks the last SLA cycle. - Export. In team-managed spaces, open a report, choose More, then Export to CSV. For per-request times, Atlassian's automation article, updated on 9 July 2026, uses a scheduled rule to copy each completed cycle's elapsed time into a text field, one field per SLA. You then export the queue to CSV.
Before sharing a number, agree whether the review covers requests created in the period or cycles completed in it. Our guide to reviewing SLA breaches explains the difference.
Where it runs out
- Averages, not rows. The Time to resolution report plots a daily average. A list of every request with its SLA time needs the automation workaround.
- Text fields. The workaround stores the time as text, with a field and a rule edit for each SLA.
- Export. The pages we read for company-managed spaces describe no report export. The CSV step is documented for team-managed spaces.
- Breakdowns. A priority split means one series per priority, within the 20-series limit.
- PDF. The pages we read describe no PDF summary of an SLA report for a client.
- Resolution day. The Time to resolution article groups work items by the day they were resolved. A review of requests created in a month needs your own JQL.
Option: SLA & Time to Resolution Reports
Disclosure: Atesen Software makes this app. The manual steps above work without it.
SLA & Time to Resolution Reports is an Atlassian Forge app for Jira Service Management Cloud. You choose a service project and a request-created date range, then pick the exact first response and resolution SLA metrics your project uses. Custom and translated names work.
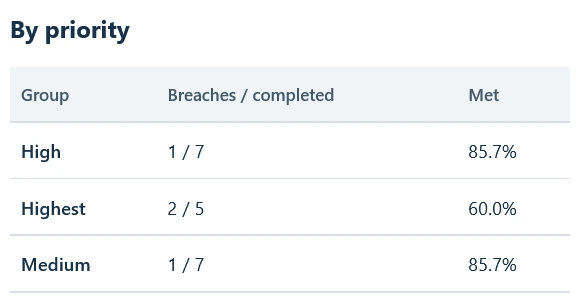
- Native outcomes. Completed-cycle compliance counts known met and breached cycles. Ongoing cycles and unknown outcomes stay separate.
- Trends and breakdowns. Completed cycles are grouped by stop month in UTC, then by current priority and issue type.
- CSV and PDF. Your browser builds a CSV of request detail and a PDF summary, with the cohort, the chosen metrics and any coverage gaps.
- Working-hours preview. It compares elapsed time for a chosen interval with a time zone, weekday hours and holiday dates. It does not change Jira's SLA values.
- Read-only. It asks for one scope, read:jira-work, reads as the signed-in person and stores no report data.
Good to know. A report covers up to 93 days of created requests and scans at most 500. Its cycles belong to that request cohort, so it is not a count of every cycle that ended in the period. Priority and issue type are the current values, not those at completion. Missing SLAs and inaccessible requests show as coverage gaps. It needs JSM agent permission and a service project with native SLA metrics, and production reports need an active Marketplace licence or trial. Atesen Software lists live checks of native SLA scenarios and licence behaviour as not yet verified. See the Marketplace listing for pricing and trial. More on the app is on its product page.
See SLA & Time to Resolution Reports on the Atlassian Marketplace
Which route fits
- A daily average or met vs breached count: the built-in reports.
- A list of breached requests: JQL.
- One CSV with per-request SLA times, with upkeep: the automation rule.
- A cohort review with CSV detail and a PDF for a client: an app.
Atesen Software is independent. Atlassian and Jira are trademarks of Atlassian, and this page is not affiliated with or endorsed by Atlassian. The Atlassian pages cited here were checked on 13 November 2026. Menus and options can change.
Questions about this guide: support@atesensoftware.com.
Questions people ask
How do I see SLA breaches in Jira Service Management Cloud?
Open Reports in your service space and read SLA met vs breached. To list the requests, use JQL such as "Time to resolution" = everBreached().
Can I export an SLA report from Jira Service Management Cloud?
Atlassian documents Export to CSV on reports in team-managed spaces. The company-managed pages we read describe no report export. Atlassian's automation article copies elapsed SLA time into a field so that a queue export includes it.
What is the difference between the Time to resolution report and the Resolution Time gadget?
The report uses your SLA calendar, pauses and conditions. The gadget subtracts Created from Resolution and counts every hour, per Atlassian's article.
Does the Time to resolution report show the time for each ticket?
No. Each dot is the average for the work items resolved that day. Per-request times need the automation workaround or an app.
Does SLA & Time to Resolution Reports change my SLA data?
No. It requests the read:jira-work scope and reads as the signed-in person. Jira stays the source of truth for goals, pauses, calendars and breach outcomes.